Graphviz for lab configuration visualization
Mon, Oct 27, 2014Setting up my lab environment for testing can be messy and confusing. I’m not just talking about the cable mess, but also how my 8 initiator systems are going to connect to my 2 target systems so that they’ve each got multiple paths. Different multipath options affect the resulting performance numbers, so it’s important to have the multiple paths.
To help me visualize how I was going to have to address my NICs (for a 40Gb/s iSCSI test) for an even distribution between my initiators, I started by drawing it out on paper. But that’s not very good for documenting my configuration for the test library archive. So I looked into more portable options and found Graphviz. This isn’t an obscure piece of software, I’ve seen it mentioned around, but I didn’t know how easy it is to get started using it. I don’t really run any Linux systems with a GUI but it’s available on my Mac via Homebrew.
A pretty simple .dot file like this:
graph iscsi {
// $ dot -Tpng iscsi.dot -o iscsi.png
  graph [pad=".75", ranksep="5.50", nodesep="0.25"];
  node [shape=box]
  rankdir = LR

  subgraph cluster_t5 {
    label = "t5";
    target51 [label="eth2"]
    target52 [label="eth4"]
    target53 [label="eth6"]
    target54 [label="eth7"]
  }
  subgraph cluster_t6 {
    label = "t6";
    target61 [label="eth2"]
    target62 [label="eth4"]
    target63 [label="eth6"]
    target64 [label="eth7"]
  }

  n10 -- target51 [label="192.168.11.x"]
  n10 -- target52 [label="192.168.13.x"]
  n10 -- target61 [label="192.168.11.x"]
  n10 -- target62 [label="192.168.13.x"]
  n11 -- target53 [label="192.168.12.x"]
  n11 -- target54 [label="192.168.14.x"]
  n11 -- target63 [label="192.168.12.x"]
  n11 -- target64 [label="192.168.14.x"]
  n12 -- target51 [label="192.168.11.x"]
  n12 -- target52 [label="192.168.13.x"]
  n12 -- target61 [label="192.168.11.x"]
  n12 -- target62 [label="192.168.13.x"]
  n13 -- target53 [label="192.168.12.x"]
  n13 -- target54 [label="192.168.14.x"]
  n13 -- target63 [label="192.168.12.x"]
  n13 -- target64 [label="192.168.14.x"]
  n14 -- target51 [label="192.168.11.x"]
  n14 -- target52 [label="192.168.13.x"]
  n14 -- target61 [label="192.168.11.x"]
  n14 -- target62 [label="192.168.13.x"]
  n15 -- target53 [label="192.168.12.x"]
  n15 -- target54 [label="192.168.14.x"]
  n15 -- target63 [label="192.168.12.x"]
  n15 -- target64 [label="192.168.14.x"]
  n16 -- target51 [label="192.168.11.x"]
  n16 -- target52 [label="192.168.13.x"]
  n16 -- target61 [label="192.168.11.x"]
  n16 -- target62 [label="192.168.13.x"]
  n17 -- target53 [label="192.168.12.x"]
  n17 -- target54 [label="192.168.14.x"]
  n17 -- target63 [label="192.168.12.x"]
  n17 -- target64 [label="192.168.14.x"]

}
Produces a graph like this:
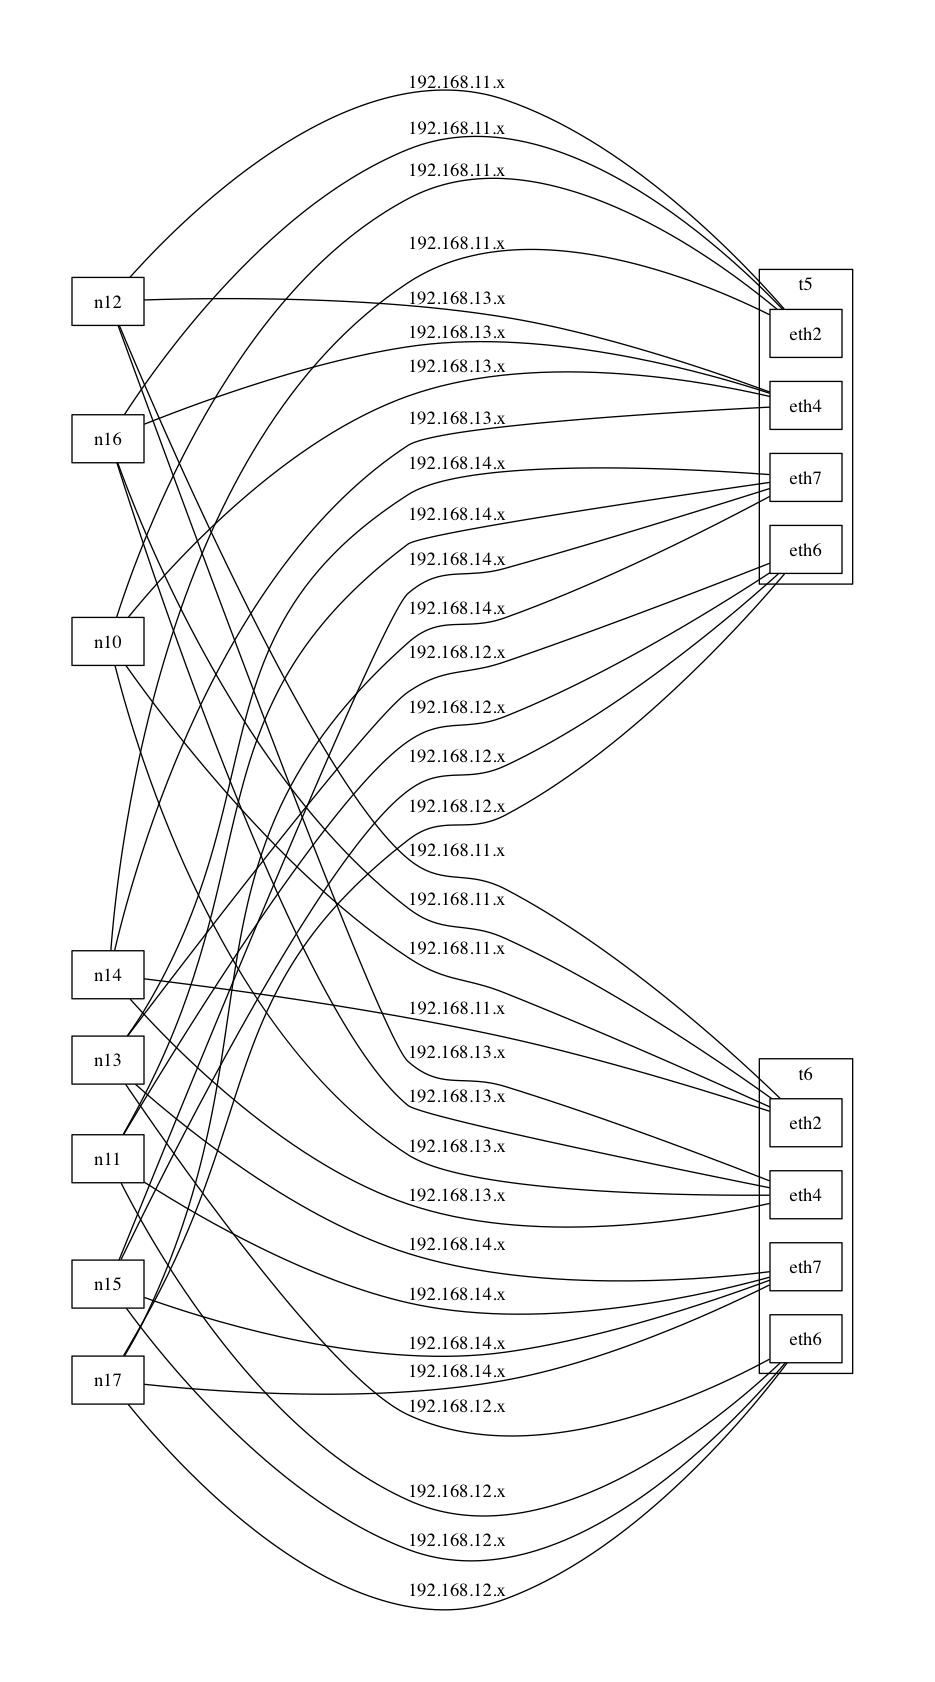
All with a simple command, in this case: $ dot -Tpng iscsi.dot -o iscsi.png
It’s much more flexible than that, but the one thing I wish it had was output to ascii. Graph-Easy has ascii output, even from the Graphviz .dot files, but the rendering isn’t too great in my testing.